
From Bonds to Bitcoin: Preserving Wealth in the Era of Fiscal Dominance

This essay expands upon the core ideas from Lyn Alden’s recent talk at Bitcoin2025 titled“Nothing Stops This Train”. In the following collection of 6 graphs, I’ll explain the current predicament that policy makers find themselves in, driven by unsustainable debt. This situation appears to be causing capital flight to high quality scarce assets, such as gold and bitcoin.
I will focus on statistics from the United States because the US dollar is the world’s reserve currency, and many countries around the world are facing similar debt challenges to the US. The major exceptions, meaning countries that are not over-indebted, are the nordic countries (particularly Norway, Denmark and Sweden), oil rich countries (particularly Qatar, Kuwait, Brunei, UAE and Oman), and Russia.1
Unemployment and Fiscal Deficits
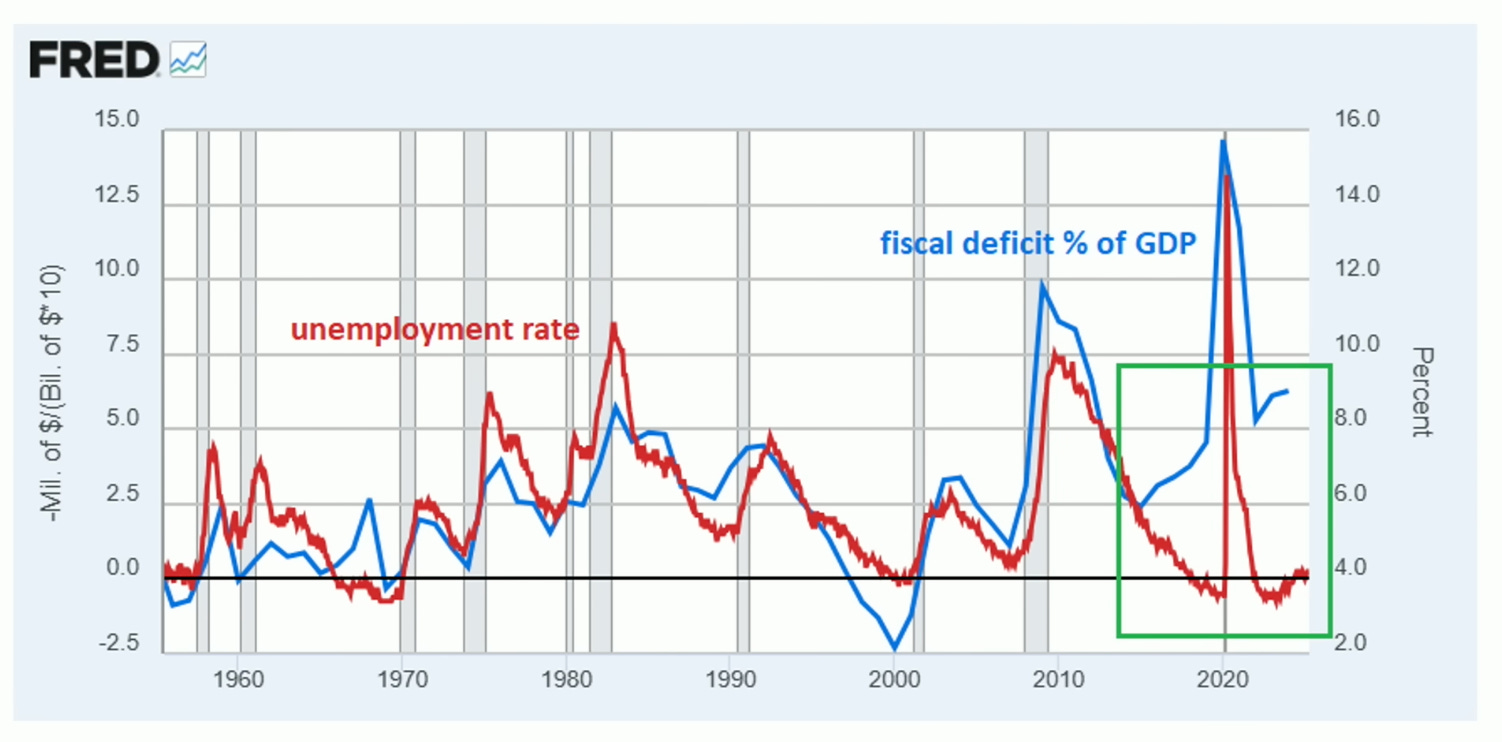
From the 1960s through 2017, the US unemployment rate (blue line) and the US federal deficit as a percentage of GDP (red line) moved together with remarkable consistency. The only historical exception was during the Vietnam War in the 1960s.
Now, look at the right side of the above chart highlighted in green: something unprecedented occurred around 2017. Unemployment continued falling while deficits steeply increased from 6% of GDP in 2017, to 16% of GDP in 2020. This new phenomenon began prior to the pandemic and has continued after the pandemic. It appears as though the US has entered a new paradigm of fiscal dynamics where the unemployment rate has detached from the fiscal deficit.
Gold and Real Interest Rates (Inverted)
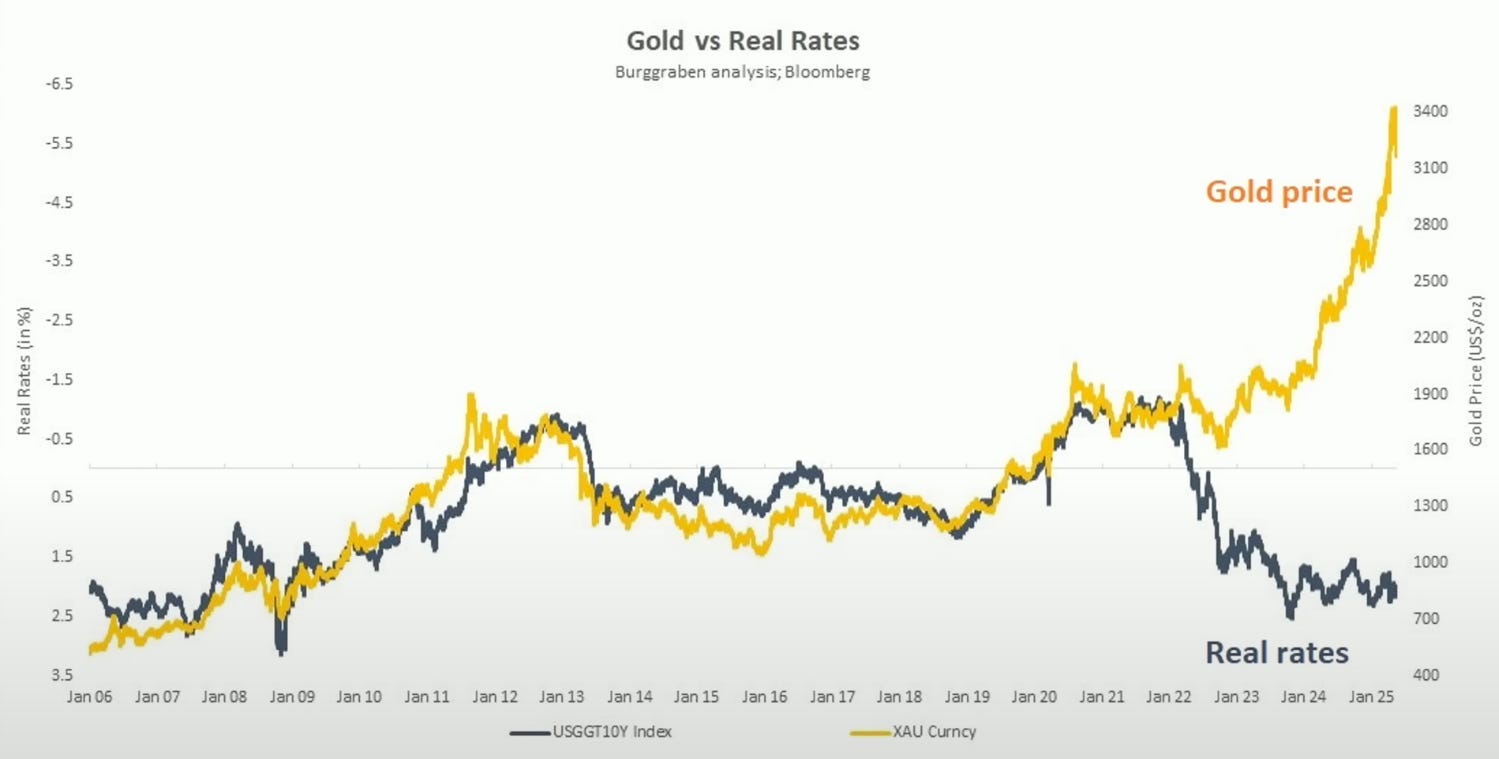
This second chart reveals another unusual relationship. Historically, gold prices (yellow line) moved inversely with real interest rates (black line, inverted scale).2 When real rates were high, gold fell. When real rates were low or negative, gold increased in value. This relationship made sense: if investors can earn an attractive real rate of return holding Treasury bonds, why would they choose to hold non-yielding gold? However, starting in 2022, this decades-long correlation between gold and real rates decoupled. Gold prices have surged to $3,500 an ounce even as real interest rates climbed to 5%. This phenomenon does not square neatly with traditional Keynesian economics.
It’s possible that Bitcoins rise in 2024 / 2025 is part of the same overarching narrative. In 2021, the Bitcoin price surged 300%, however many speculated that this was merely a “zero rate phenomenon”, meaning that Bitcoin could only command a significant market price when interest rates remained at the zero lower bound; in a high interest rate environment, when investors could earn a meaningful real yield on US Treasuries, the Bitcoin price would fall precipitously and never recover. Interestingly, these economists predicting the fall of Bitcoin in a high interest rate environment have been proven wrong, as Bitcoin surpassed $100,000 in late 2024, despite interest rates of 5% and real yields of 3%. This indicates that something structural has shifted in how markets are responding to monetary policy.
Private and Public Sector Debt Growth
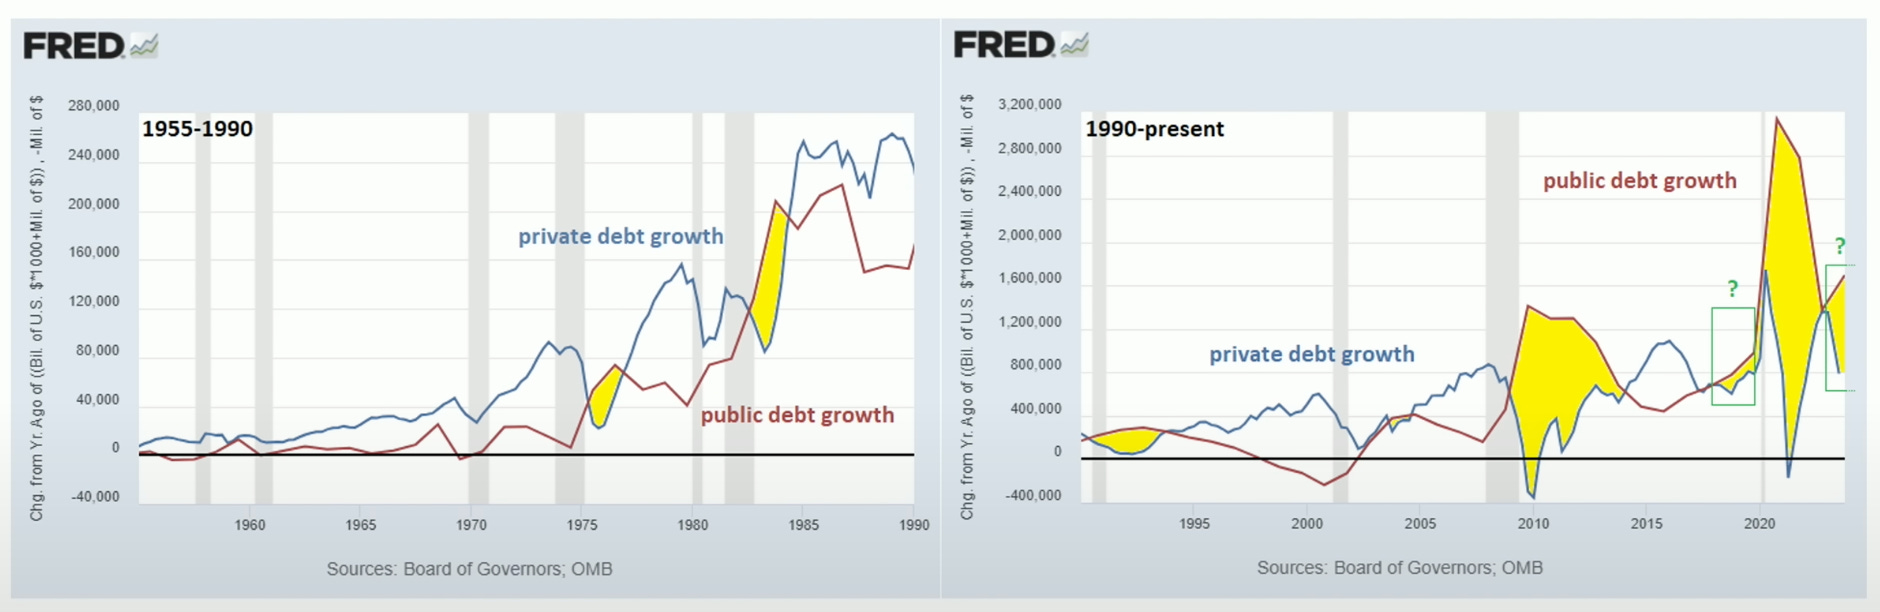
These dual charts reveal another important structural shift. The left panel shows that from 1955 to 1990 private sector debt growth (blue line) typically exceeded federal debt growth (red line) with exceptions only during recessions. The periods where public sector debt growth outpaced private sector growth are highlighted in yellow.
The right panel from 1990 to the present tells a different story. Since the 2008 financial crisis, public sector debt growth has consistently outpaced private sector debt growth, even outside of recessions (green boxes). The implication is that as the financial system becomes increasingly over-indebted, rather than allowing the system to naturally de-lever through insolvencies and severe downturns, the debts are instead rolled from the private sector to the public sector as a policy response during times of crisis (e.g. bank bailouts in 2008 financial crisis and stimulus in 2020 covid pandemic). Over the last 70 years, as the entire system has become more levered, the economic crises have also become more frequent; this causes the public sector debt growth to dominate the private sector.
10-Year Treasury Rates and Debt-to-GDP
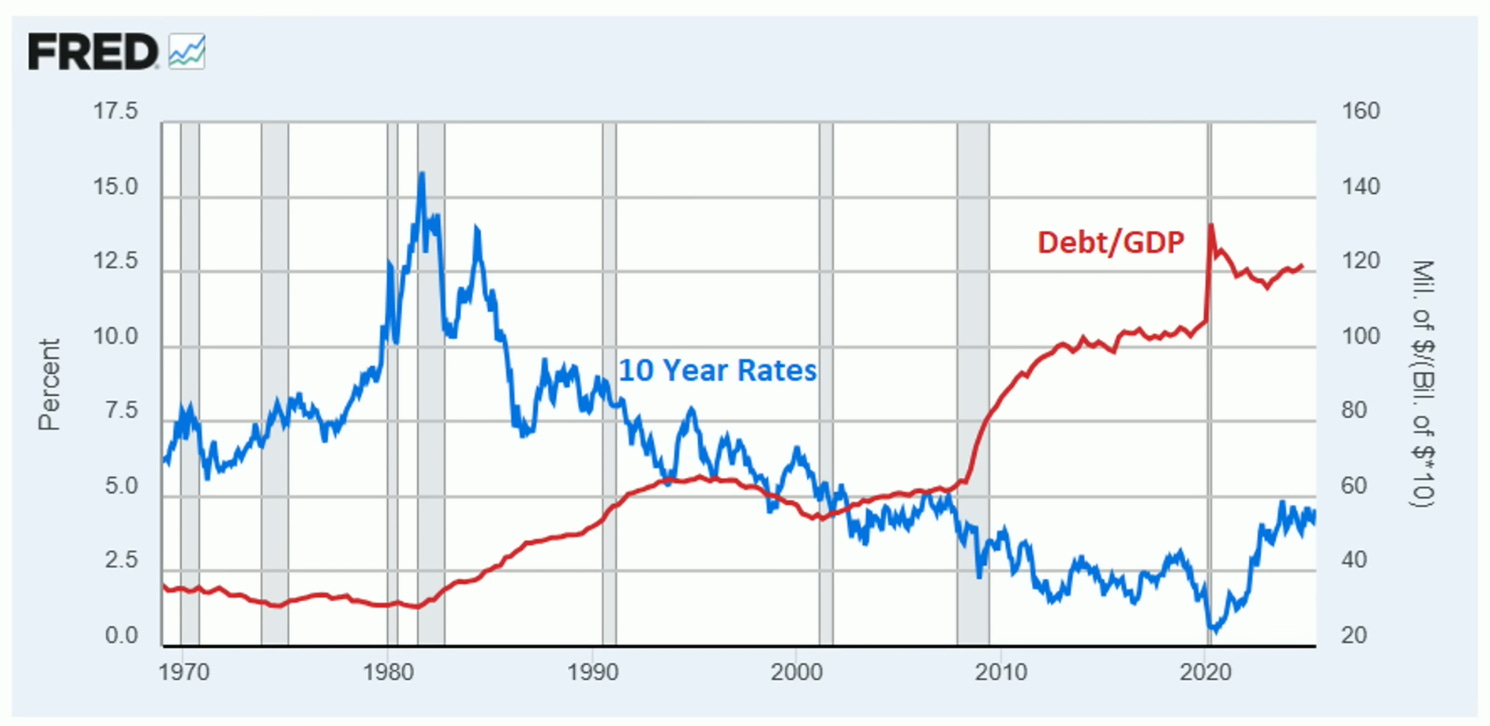
For the previous four decades (1980 to 2020), rising debt levels (red line) were offset by structurally declining interest rates (blue line). This meant that despite the fact that debt-to-GDP doubled from 60% to 120%, the US federal government’s debt servicing costs remained manageable because interest rates were declining until 2021. Today, the 10-Year Treasury Rate is near 5%, which makes it much more complicated for the government to manage debt servicing costs at 120% debt-to-GDP.
Firstly, what is driving this increase in interest rates since 2021? There are two primary factors:
Persistent moderate inflation has forced the Federal Reserve to increase short-term rates from 0% in March 2020 to a peak of 5.5% in July 2023.
The 10-Year Treasury Rate follows short-term rates, with a spread. That spread reflects supply and demand in the treasury market, in addition to growth and inflation expectations. Market demand for US Treasuries has been somewhat weak, and the market anticipates moderate long-term inflation, causing 10-Year Treasury rates to hover in the 3-5% range.
Now, the challenge that policy makers face is that in a high interest rate and high debt-to-GDP environment, when the Fed raises interest rates to cool inflation, they unintentionally grow the federal deficit faster than they slow private sector borrowing, because higher rates increase government spending on interest payments. In turn, higher government spending makes US Treasuries less attractive to investors, despite higher interest rates, because the government’s overall debt load is viewed as unsustainable, and therefore Treasuries are no longer risk-free. And if US Treasuries have a meaningful risk premium, investors begin to consider gold and potentially Bitcoin as viable alternatives to government bonds in portfolio construction.
This creates a difficult policy trap: if the policy makers keep rates low, investors flee to scarce assets like Bitcoin and gold. But if policy makers keeps rates high, they risk blowing out the deficit even further, pushing investors to flee to Bitcoin and gold. This is a lose-lose situation that has manifested over the last 50 years and now appears to be at a tipping point. Now, the Fed no longer has a tool to slow down credit growth in the overall system.
Social Security Trust Fund
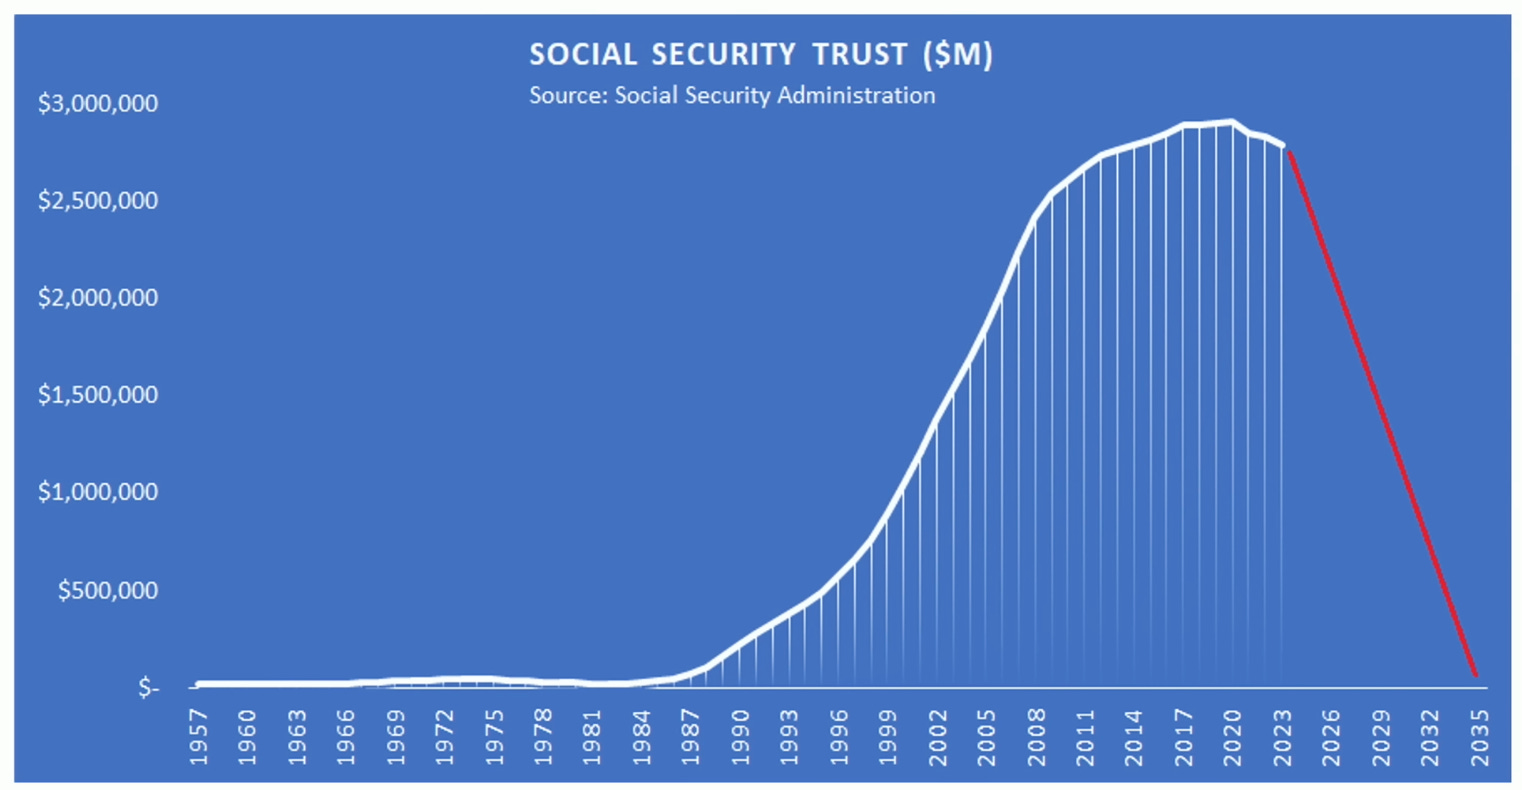
This chart shows the Social Security Trust Fund’s rise and fall. It appears to have peaked at roughly $3 trillion in 2017 before beginning its decline towards projected depletion by 2035, as forecast by the Social Security Trustees themselves. The depletion of the fund is driven by fundamental demographic shifts that cannot easily be changed: retiring baby boomers, aging population, low birth rates and longer life expectancy. Given that both political parties have vowed not to reduce social security benefits, and the baby boomers are the largest voting bloc, the depletion of social security financing appears to be inevitable.
As the Social Security Trust nears depletion, there will be significant pressure on Congress to increase deficit spending even further in order to fill any funding shortfall. Payroll taxes are projected to be sufficient to cover 83% of benefits. Given that total benefits are forecast to total $2.3 trillion annually by 2035, Congress must find an additional $400 billion annually to maintain the status quo.
Total Debt and Base Money
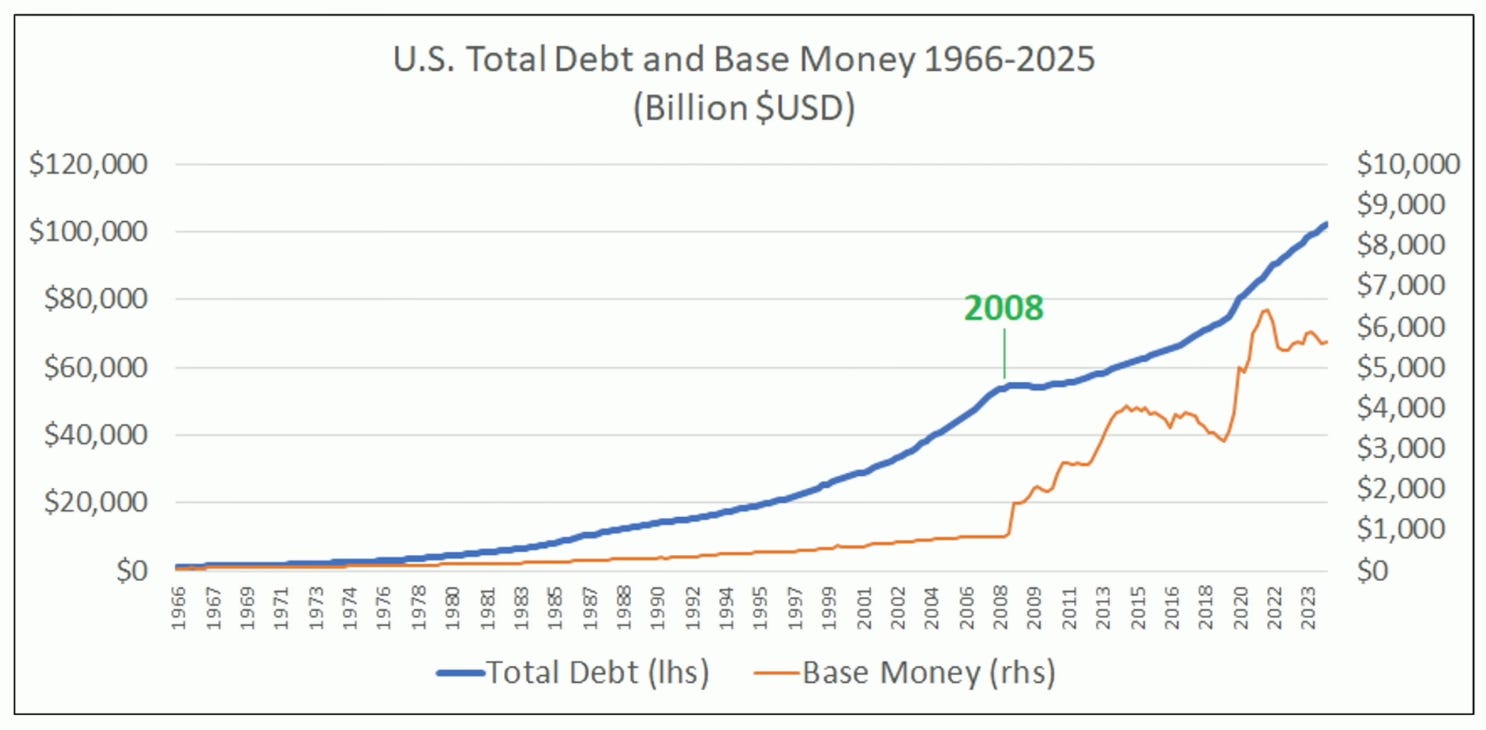
The blue line shows total US debt (public and private combined) now exceeding $100 trillion for the first time from 2023 onwards. The yellow line shows the monetary base expansion from $1 trillion to $6 trillion since 2008. Interestingly, over the previous 60 years, total system debt decreased in only one year (2008) by roughly 1%, and this was rapidly followed by an increase in the monetary base from $1 trillion to $3 trillion within 5 years, indicating that the financial system’s tolerance for deleveraging is essentially zero. During a crisis, when debt is on the verge of contracting, the powers that be rapidly expand the monetary base to keep the party going. If we look back over the last century, total system debt has decreased in only five of the last 100 years: during the 1930 - 1934 Great Depression and the 2008 Financial Crisis. This system relies upon continuous debt expansion to survive.
Monetary and Fiscal Policy, Debt as a % of GDP
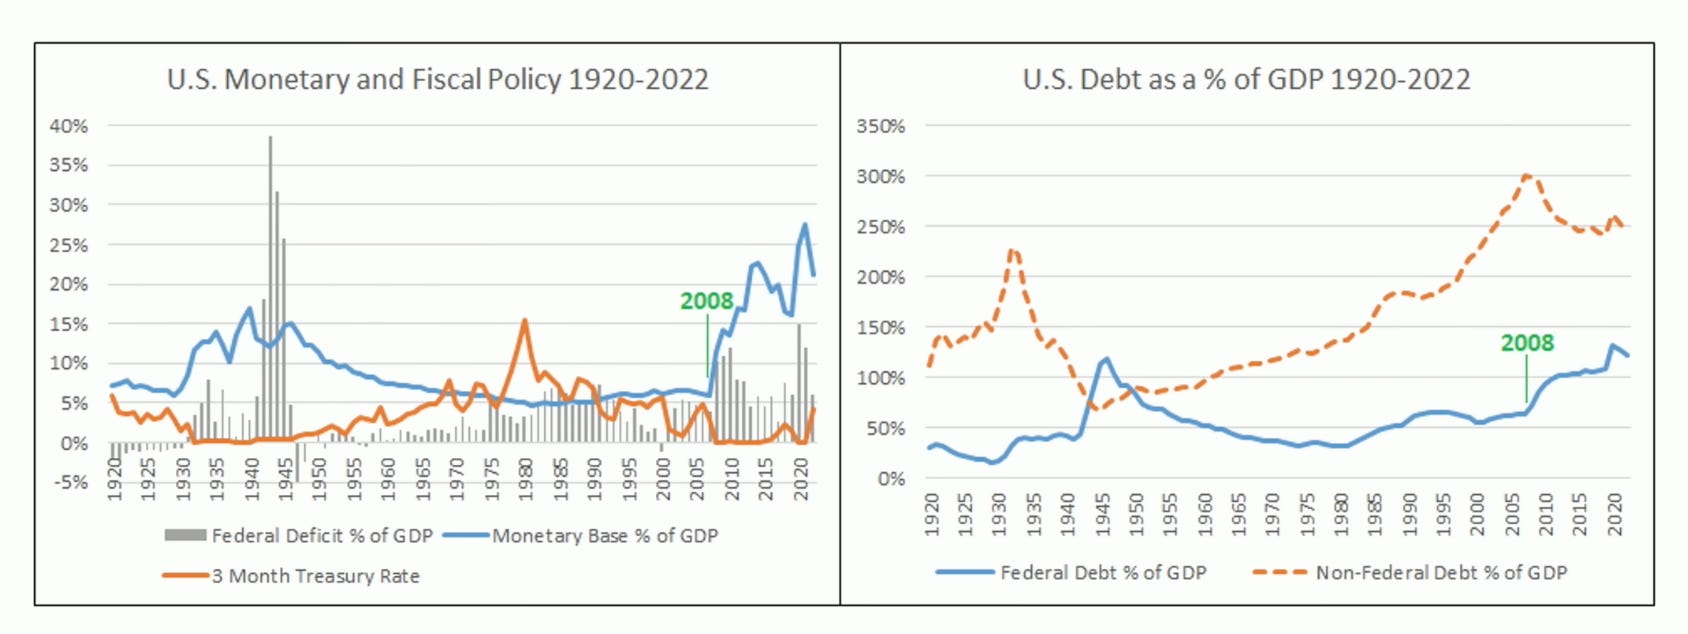
The two charts above reveal a noteworthy parallel between the 1940s and the post-2008 monetary and fiscal regime:
Large government deficits, and debt-to-GDP above 100%
Interest rates reaching the zero lower bound
Fiscal policy taking precedence over monetary policy
In the 1940s, non-federal debt as a percentage of GDP began shrinking just as federal debt spiked due to wartime spending. Similarly, after 2008, private sector debt peaked around 300% of GDP and began contracting, while federal debt immediately accelerated. This represents a systematic “debt rotation” where the economy switches between private-led and public-led debt growth phases. When private debt bubbles reach unsustainable levels and interest rates hit zero, removing banks’ incentive to lend, the system does not allow for overall deleveraging. Instead, debt accumulation shifts to the public ledger to offset any shrinkage in private debt, ensuring that total system debt maintains its smooth, persistent upward trajectory. The modern financial system has developed institutional mechanisms to prevent total debt contraction as this would threaten the integrity of entire structure.3
However, the macroeconomic environment today is in many ways even more complex and constrained than it was in the 1940s. Total system debt, including public and private sector, is now 370% of GDP, compared to 190% of GDP in 1945. During the 1940s, the Federal Reserve was not yet independent from the Treasury, which allowed for close coordination between the two institutions. This cooperation led the Fed to peg long-term interest rates at 2.5% and short-term rates at 0.375%, enabling the government to finance World War II and service the resulting debts at low cost. This level of alignment between fiscal and monetary policy is extremely unlikely today, given that the 1951 Fed-Treasury Accord formally established the independence of the Federal Reserve.
Why Bitcoin?
This backdrop explains Bitcoin’s appeal. The existing system is characterised by:
Ever increasing supply of monetary units
Opaque setting of monetary policy from old men with magic balls
Continuous leverage expansion
In contrast, Bitcoin offers:
Absolute scarcity, with fixed 21 million coin limit
Predetermined monetary policy and supply schedule, with the last coins minted in the year 2140
Demographics, political incentives, and the mathematical structure of our debt-fuelled system all point towards persistent 7% annual deficit growth for the foreseeable future. This will not necessarily cause hyperinflation, but simply persistent moderate inflation.
In this era of fiscal dominance, government bonds become guaranteed negative real returning instruments. Owning high quality scarce assets like Bitcoin and gold is becoming increasingly crucial for maintaining purchasing power over time.
Footnotes
Interestingly, some low income countries have very low debt levels, largely because these countries lack access to international capital markets. For instance, the Democratic Republic of Congo has 14% debt-to-GDP.
The real rate is the 10 year US government treasury rate, less inflation (measured by the Consumer Price Index)
Which assets outperformed during the 1940s? Equities, real estate, and commodities performed reasonably well over the decade (6-7% annualised real returns), while government 10-year bonds and short-term bills / cash performed very poorly (negative 2-5% annualised real returns). The poor performance of bonds and cash was driven by the Federal Reserve’s intervention in the market, capping interest rates below the rate of inflation in order to manage the governments borrowing costs. During the 1940s American’s could not legally own gold (executive order 6102).